Class Profiles
Enrolling Class Profiles
Fall 2022
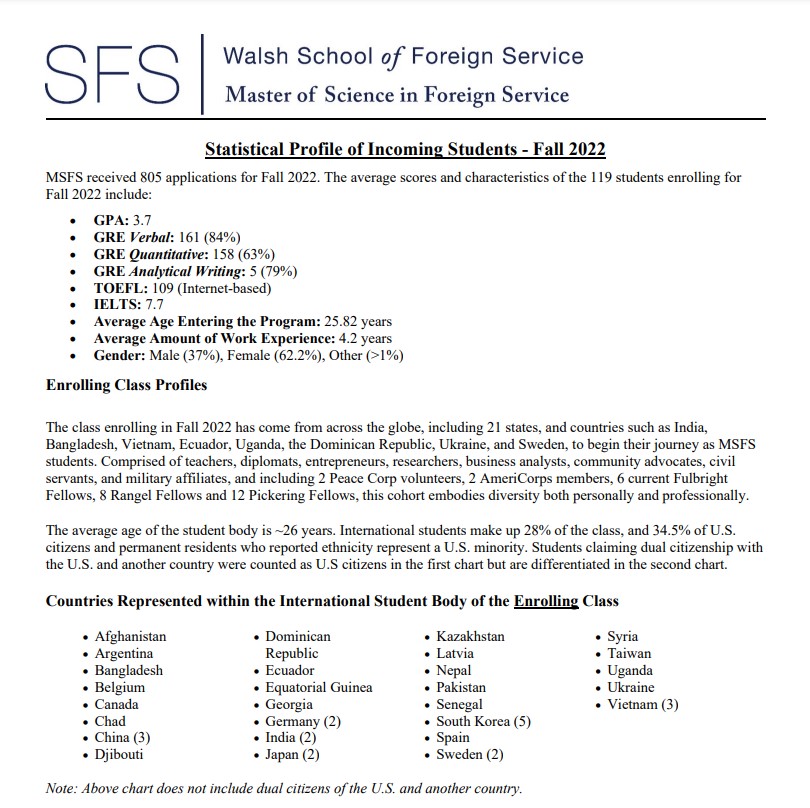
The class enrolling in Fall 2022 has come from across the globe–including 21 states and countries such as India, Bangladesh, Vietnam, Ecuador, Uganda, the Dominican Republic, Ukraine, and Sweden–to begin their journey as MSFS students. Compromised of teachers, diplomats, entrepreneurs, researchers, business analysts, community advocates, and civil servants (including 2 Peace Corp volunteers, 2 AmeriCorps members, 6 current Fulbright Fellows, 8 Rangel Fellows, 12 Pickering Fellows, 9 military-affiliated students, and 5 Phi Beta Kappa awardees) and this cohort embodies diversity both personally and professionally.
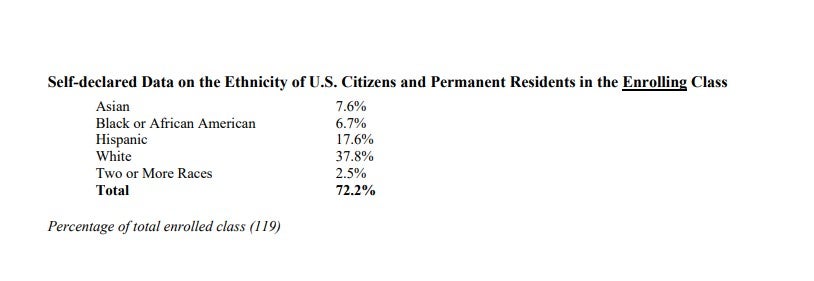
The average age of the student body is ~26 years. International students make up 28% of the class. 34.5% of U.S. citizens and permanent residents who reported ethnicity represent a U.S. minority. Students claiming dual citizenship with the U.S. and another country were counted as U.S. citizens in the first chart but are differentiated in the second chart.
Fall 2022 Statistics
Below are the average scores and characteristics of students admitted for Fall 2022:

Fall 2021
The class enrolling in Fall 2021 came from countries around the world, including Azerbaijan, India, Japan, Poland, Taiwan, and the United Kingdom, to begin their journey as MSFS students. Comprised of teachers, diplomats, business analysts, entrepreneurs, first responders, researchers, investment bankers, paralegals, lawyers, 5 Fulbright fellows, 3 Rangel fellows, 4 Peace Corps volunteers, 3 Pickering fellows, a Boren fellow, 22 military-affiliated students and Phi Beta Kappa awardees, this cohort embodies diversity both professionally and personally.
The average age of the student body is 26.4. International students make up 24% of the class, and 28% of U.S. citizen and permanent resident students who reported ethnicity represent a U.S. minority. Students claiming dual citizenship with the U.S. and another country were counted as U.S. citizens in these statistics.
Fall 2020
The class enrolling in Fall 2020 came from countries around the world, including countries such as China, Ghana, Kyrgyzstan, Mexico, Pakistan, Sweden, and the United Kingdom, to begin their journey as MSFS students. Comprised of teachers, diplomats, business analysts, first responders, researchers, investment bankers, paralegals, 9 Fulbright fellows, 8 Peace Corps volunteers, 4 Rangel fellows, 2 Pickering fellows, a Boren fellow, 12 military-affiliated students and a host of Phi Beta Kappa awardees, this cohort embodies diversity both personally and professionally.
The average age of the student body is 26.4. International students make up 22% of the class, and 29% of U.S. citizens and permanent residents who reported ethnicity represent a U.S. minority. Students claiming dual citizenship with the U.S. and another country were counted as U.S citizens.
Fall 2019
The class enrolling in Fall 2019 came from across the globe, including countries such as China, Colombia, Qatar, Sri Lanka, Thailand, and the United Kingdom, to begin their journey as MSFS students. Comprised of television producers, teachers, diplomats, business analysts, researchers, law enforcement professionals, 7 Fulbright fellows, 4 Rangel fellows, 4 Peace Corps volunteers, 2 Boren Fellows, 2 Pickering Fellows, 11 military-affiliated students and Phi Beta Kappa awardees, this cohort embodies diversity both personally and professionally.
The average age of the student body is 26.7. International students make up 22% of the class, and 28% of U.S. citizens and permanent residents who reported ethnicity represent a U.S. minority. Students claiming dual citizenship with the U.S. and another country were counted as U.S citizens.
International Countries Represented
| 2022 | 2021 | 2020 | 2019 |
|---|---|---|---|
|
|
|
|
| 28% international | 24% international | 22% international | 22% international |
Numbers do not include dual citizens of the U.S. and another country
* indicates more than one enrolling student
U.S. Students Born in Other Countries or Dual Citizens*
- Albania
- Brazil
- Dominican Republic
- Egypt
- El Salvador
- Greece
- Mexico(2)
- Pakistan
- South Korea
- Spain
- Syria
- Taiwan
*For the incoming class this Fall 2022
When more than one student per country, the total number of enrollees is indicated in (parentheses).
Self-declared Data on Ethnic Diversity
| Group | 2022 | 2021 | 2020 | 2019 |
|---|---|---|---|---|
| African American | 6.7% | 4% | 6% | 7% |
| Asian/Pacific American | 7.6% | 9% | 10% | 4% |
| Hispanic | 17.6% | 9% | 5% | 13% |
| Native American/Alaska Native | 0% | 1% | 1% | 0% |
| Multiple | 2.5% | 6% | 8% | 4% |
| TOTAL | 34.4% | 28% | 29% | 28% |
